The Cost of Waiting
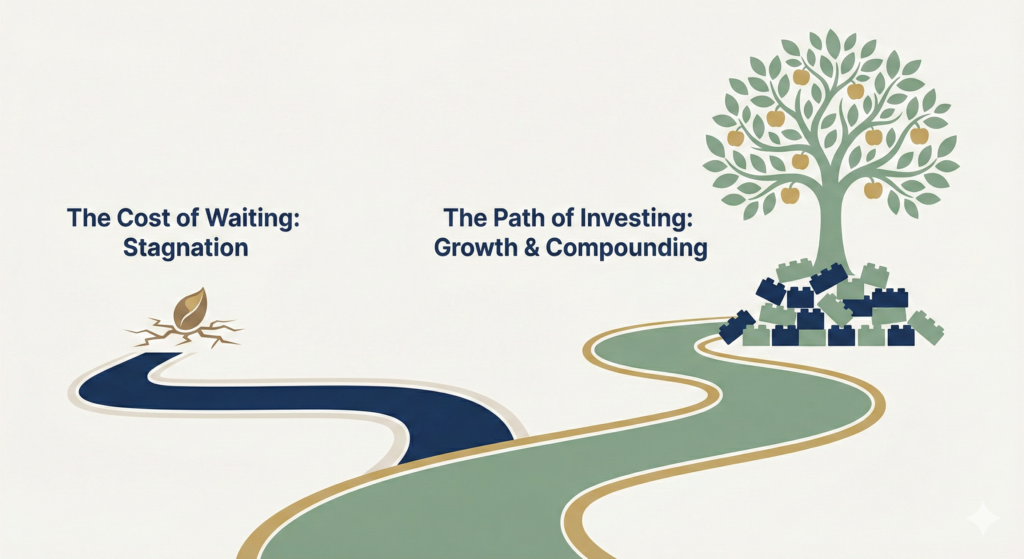
Most people plan to start investing at some point. The timing just never quite lines up. There’s always something, a bill, a move, a bit of uncertainty at work. And so the months become years.
This page is designed to show you, in concrete numbers, what those delays actually cost. Not to make you feel bad, but because the numbers are genuinely motivating once you see them.
What a 5-Year Delay Actually Costs
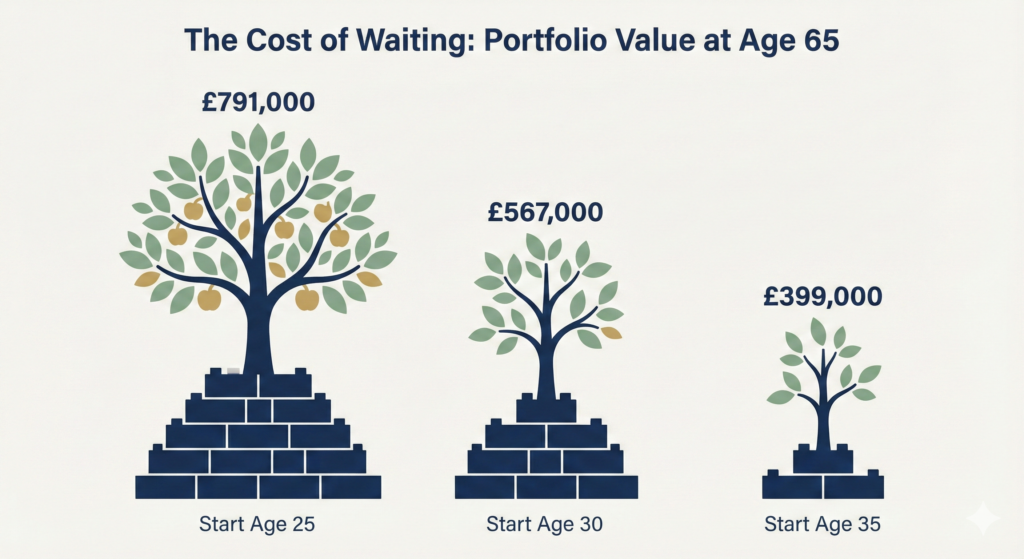
Let’s take someone investing £300 per month into a simple global index fund, assuming 7% average annual growth. We’ll compare starting at three different ages.
| Start Age | Total Invested | Portfolio at 65 | Lost by Waiting |
| Age 25 | £144,000 | £791,000 | – |
| Age 30 | £126,000 | £567,000 | £224,000 |
| Age 35 | £108,000 | £399,000 | £392,000 |
The person who waited until 35 invested £36,000 less than the person who started at 25, but ends up with £392,000 less. That’s the cost of a decade of delay. Not the money they didn’t put in. The compounding they missed out on.
The Myth of the Perfect Time to Start
One of the most common reasons people delay investing is that they’re waiting for the right moment. Waiting for markets to drop so they can buy cheaper. Waiting until they feel like they understand it better. Waiting until things settle down at work.
The research on this is clear and consistent: time in the market beats timing the market.
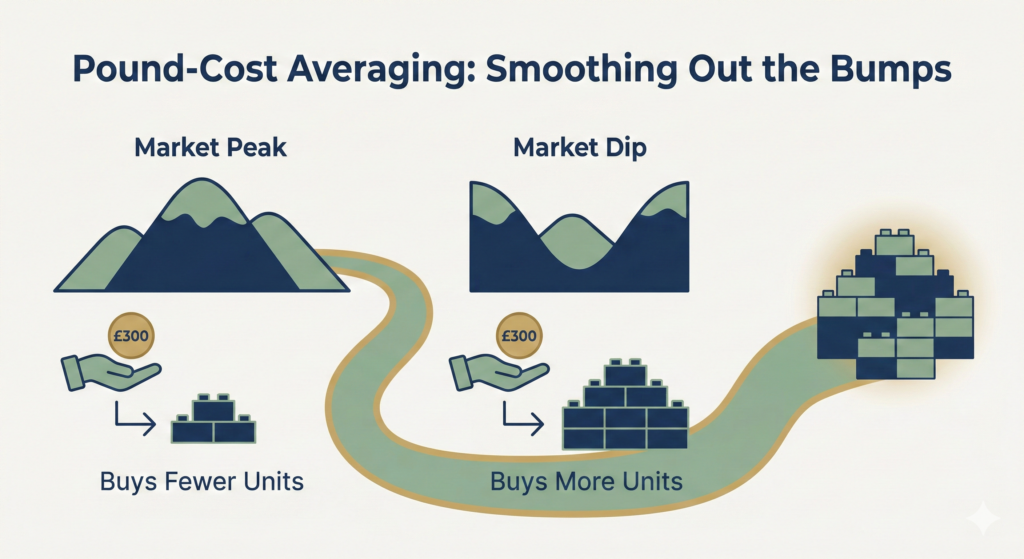
Investors who try to buy at the right moment and avoid the dips consistently underperform investors who simply invest a regular amount every single month, regardless of what markets are doing. This strategy, called pound-cost averaging, takes the guesswork out entirely.
| Pound-cost averaging in practice You invest £300 every month no matter what. When markets are up, your £300 buys fewer units. When markets are down, your £300 buys more units. Over time, you naturally accumulate more units during the cheaper periods without having to make any decision about when to buy. The averaging smooths out the bumps. |
What If I Invested a Lump Sum at Exactly the Wrong Time?
This is a fear that stops a lot of people. What if I invest my savings just before a crash?
It’s a fair question with a reassuring answer. Studies of stock market history have examined what happens when investors put a lump sum in right at market peaks, the worst possible timing. The conclusion is almost always the same: even the worst-timed investor typically outperforms the person who stayed in cash, as long as they stayed invested and didn’t panic sell.
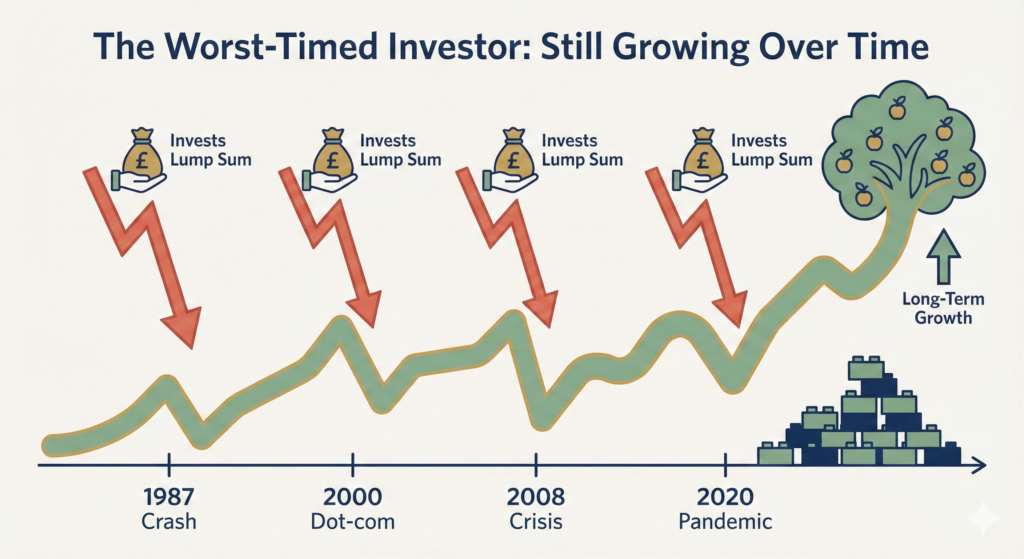
| The worst investor in the world Imagine someone who, through spectacular bad luck, invested a lump sum of £10,000 right before every major market crash of the last 40 years, the 1987 crash, the dot-com bust, the 2008 financial crisis, and the 2020 pandemic crash. Then they did nothing. No panic selling, just stayed invested. Despite catastrophically bad timing every single time, their investment would still have grown substantially over that period. The market recovered every time. It always has. |
The lesson isn’t that market crashes don’t matter. They’re deeply uncomfortable and they test your nerve. The lesson is that staying invested through them is almost always the right call, and waiting in cash trying to avoid them costs you more than the crashes themselves.
What About Smaller Amounts?
One of the most common reasons people give for not starting is that they don’t have enough money to make it worthwhile. It’s worth running the numbers on smaller amounts.
| Monthly Amount | Over 30 Years (7%) | Over 40 Years (7%) |
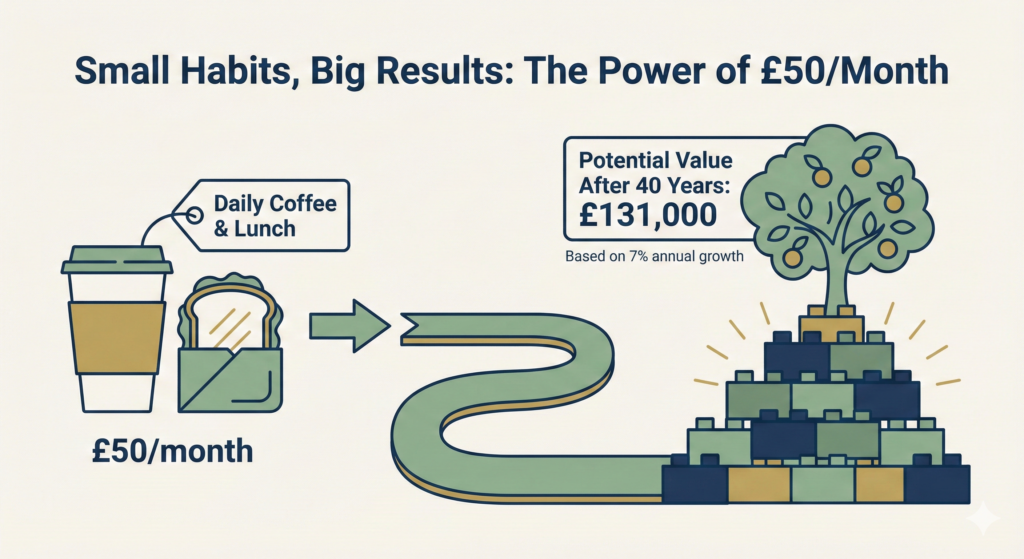
| £50/month | £60,000 | £131,000 |
| £100/month | £121,000 | £262,000 |
| £200/month | £243,000 | £525,000 |
| £500/month | £606,000 | £1,311,000 |
£50 a month doesn’t feel like much. Over 40 years at 7% it becomes £131,000. That’s the coffee and the occasional lunch most people spend without thinking. The amounts matter less than most people assume. The time matters enormously.
The Psychological Cost of Waiting
There’s a financial cost to waiting, and there’s also a psychological one. The longer you put something off, the more loaded it becomes. The decision to start investing feels bigger and more complicated the more you’ve delayed it, even though the actual act of opening an account and setting up a direct debit takes about 20 minutes.
The best way to deal with that feeling is to make the smallest possible start. You don’t have to invest your life savings. Open an account. Set up a £50 a month direct debit into a simple global index fund. You can adjust it later. The point is to start.
Cost of Waiting Calculator
Use the calculator to see exactly what delaying your investment costs you in pounds. Choose a monthly amount, an expected return, and how long you plan to invest. Then select a delay period to see the difference between starting today and waiting.
A few things worth trying:
- The default 3 year delay shows a realistic scenario for someone who keeps putting it off
- Try a 10 year delay and see how dramatic the cost becomes
- The cost of waiting figure in red is the actual pounds lost to delay, not a percentage
- Reduce the monthly amount to see that even small regular investments are worth starting immediately
| A note on returns The figures in this page use 7% annual growth as an illustrative example based on long-run historical averages for global equity markets. Future returns cannot be guaranteed. Markets go up and down. These numbers are designed to illustrate the power of compound growth over time, not to predict what you will earn. |
| Not financial advice This page is educational content explaining the mathematical impact of investing at different times. It is not a recommendation to invest any specific amount or in any specific product. Please consider your own financial situation before making any investment decisions. |
What Next?
You understand why investing matters, how compounding works, and what waiting costs. The natural next step is your first steps, a straightforward guide to actually getting started, including which account to open and what to put in it.